Fun with Stock Screeners - Part 1
For those of you who don’t know, Stock screeners are websites /aps that allow you to filter out listed companies based on various parameters - PE Ratios, PAT growth, Sales growth, Market Cap, Free Cash Flow etc.
While these are but tools an investor can use to help arrive at their investment decision, the real value could possibly lie in coming up with a set of rules (based on financial parameters) that could throw up companies that are good investment options. The underlying assumption being that these parameters while mostly reflecting past performance will generally indicate similar or close to similar future performance. The trick of course is finding the right financial parameters that would bolster this assumption.
For example, instead of filtering companies with more than say INR 1000 Cr PAT in the last FY, we could perhaps look at PAT growth of >10% CAGR over 5 years (provided your screener can pull out this data).
For the purpose of this article and in general, I will be using Screener.in. The interface is user friendly and the queries to filter out companies by financial parameters are intuitive.
So the aim here wold be to give a set of parametric constraints that I feel would indicate good future financial performance based on the past performance on these parameters.
Case 1: The first screener is:
https://www.screener.in/screens/893129/pradhyumna-bhat-experiment-with-screeners-1/

Based on the snippet, one can see that we have called for a list of companies that have
a. PAT > INR 1000 Cr (AND)
b. 5 Year Profit Growth (CAGR) >12% (AND)
c. Market Capitalization <INR 5000 Cr
d. 5 Year Sales Growth >12%
The logic behind this set was to see if there were any small to medium sized companies (less than INR 5000 Cr Market Capitalization) that was not only growing rapidly in terms of sales and profitability (>12%) consistently over 5 years, but had also reached a PAT of at least INR 1000 Cr in the previous FY. In my opinion, such companies could be considered as "undiscovered" by the larger market. We could of course make it more stringent by introducing limits on debt to equity ratio, promoter holding floor etc., but that is for another case.
What gives me some confidence that these parameters are indeed stringent is that only one listed company seems to fit these parametric constraints (the limitation being that any listed Indian company not covered by Screener.in, if any, would not show up in this filtration).
The name of the company thus shortlisted is Uflex Limited. Now, for this article, I will not be going into an analysis of Uflex, but will rather be highlighting its broad financial ratios and how I think they point towards it being a company that looks good (not financial /investment advice) for investment. A full analysis would of course be more strenuous with peer comparison, forecasting etc. But for those of us going by the "feel" of a company, this could be a great place to start.
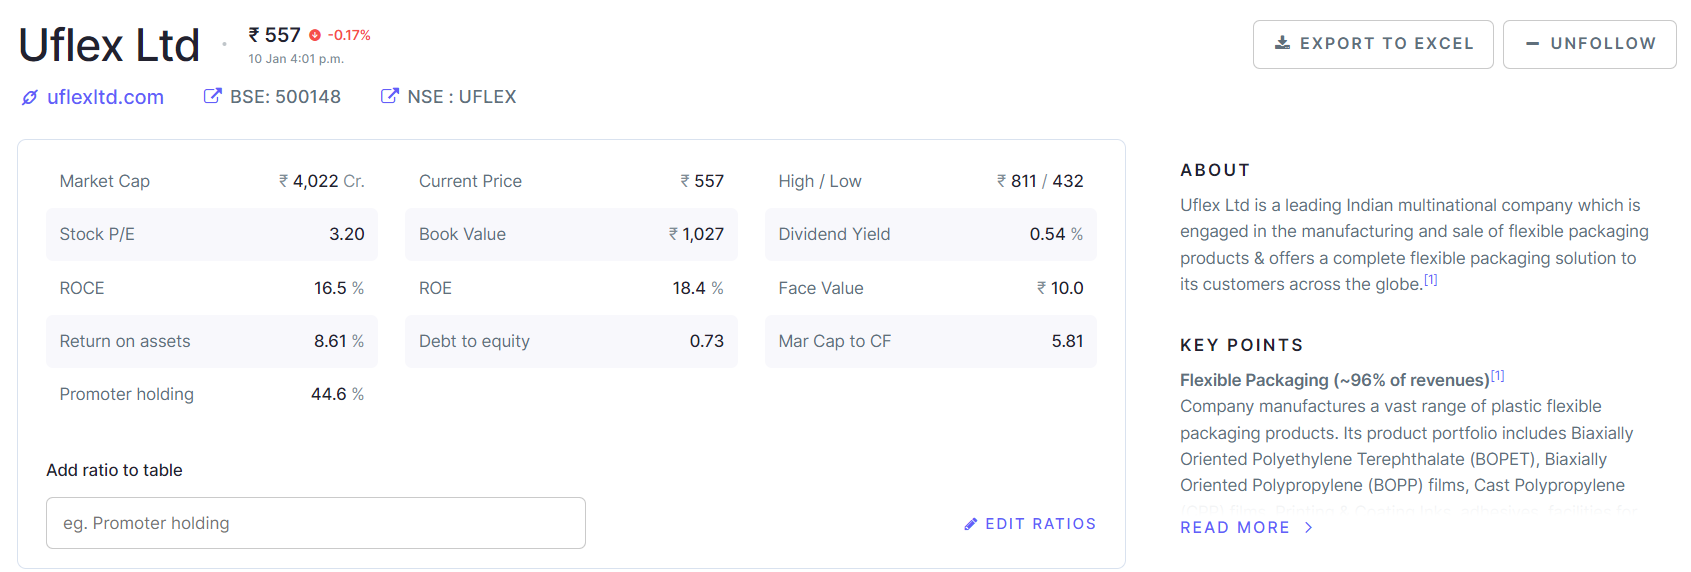
Closing remarks: As can be seen in the above snippet, Uflex is a manufacturing company involved in making packaging material. Its P/E Ratio is 3.2 with a 12 Month Trailing PAT of ~INR 1200 Cr. Furthermore, it has a 5 Year Sales CAGR of 15% and a 5 Year PAT CAGR of ~27%.
While it may not be enough to pronounce it as a sound investment, its definitely enough to pique our interest in the company (The reader may have heard of this company and be aware of its workings, but imagine a situation where the query you write throws up a genuinely undiscovered company for investment).
I aim to write a few more articles on this topic as well as go in deeper into a few of these companies. I’m quite excited to see what we find.